This project is not guaranteed to fully function and produce correct results yet, and is instead more of a theoretical demonstration of what is possible to achieve.

Introduction

In this project, I aim to create a comprehensive system for detecting and analyzing road signs using panoramic images from Google Street View. The implementation is structured into five key steps, starting from finding all streets in a specific area to visualizing the results of our data analysis. By leveraging existing APIs and AI models, we hope to gather precise information about road signs, including their classifications and locations.

This document describes the implementation details and challenges encountered during the development process.

Implementation Details

Implemented in five steps:

  1. Find all streets with coordinates for a specific area
  2. Image generation with metadata of the location for each street (multiple images per street)
  3. Image processing & road sign detection
  4. Data evaluation & crunching
  5. Visualization of results

Step 1: Find all streets with coordinates for a specific area

Two different approaches could be used

  1. One approach would be to start at a random street within the defined area and algorithmically walk into every possible street, similar to a project (Maze Generation) which I worked on. Here the Google Maps API would be used to get every possible directions and locations to move to.
  2. Specific a bounding box with coordinates for the area and use Overpass API to get all street information.

Approach 2 has been chosen because a solution for this already exists and I can just use the Overpass API, and Google Maps API is not free, so it would get pretty expensive for large areas.

Step 2: Image generation with metadata

Google Street View API is a paid service and can quickly get expensive when covering large areas.

Here I use Google Street View API to generate a 360 degree panorama picture with metadata for the street name, country, city, etc.

This panorama picture with metadata is being generated for every single road point discovered in the previous step.

Step 3: Image processing & road sign detection

Each image has to be processed and following informations have to be gathered:

Machine Learning

This step has not been fully implemented yet.

AI Models to choose from:

  1. YOLO
  2. Detectron2

Step 4: Data evaluation & crunching

With the images and their metadata there is a lot data which could help figuring out each unique road sign and its (more or less) exact location, for this I was thinking about following approaches:

  1. Group by Streetname + Streetnumber and evaluate all images for the given street, only take the image where the street sign is closest to the actual image (biggest in size on the picture).
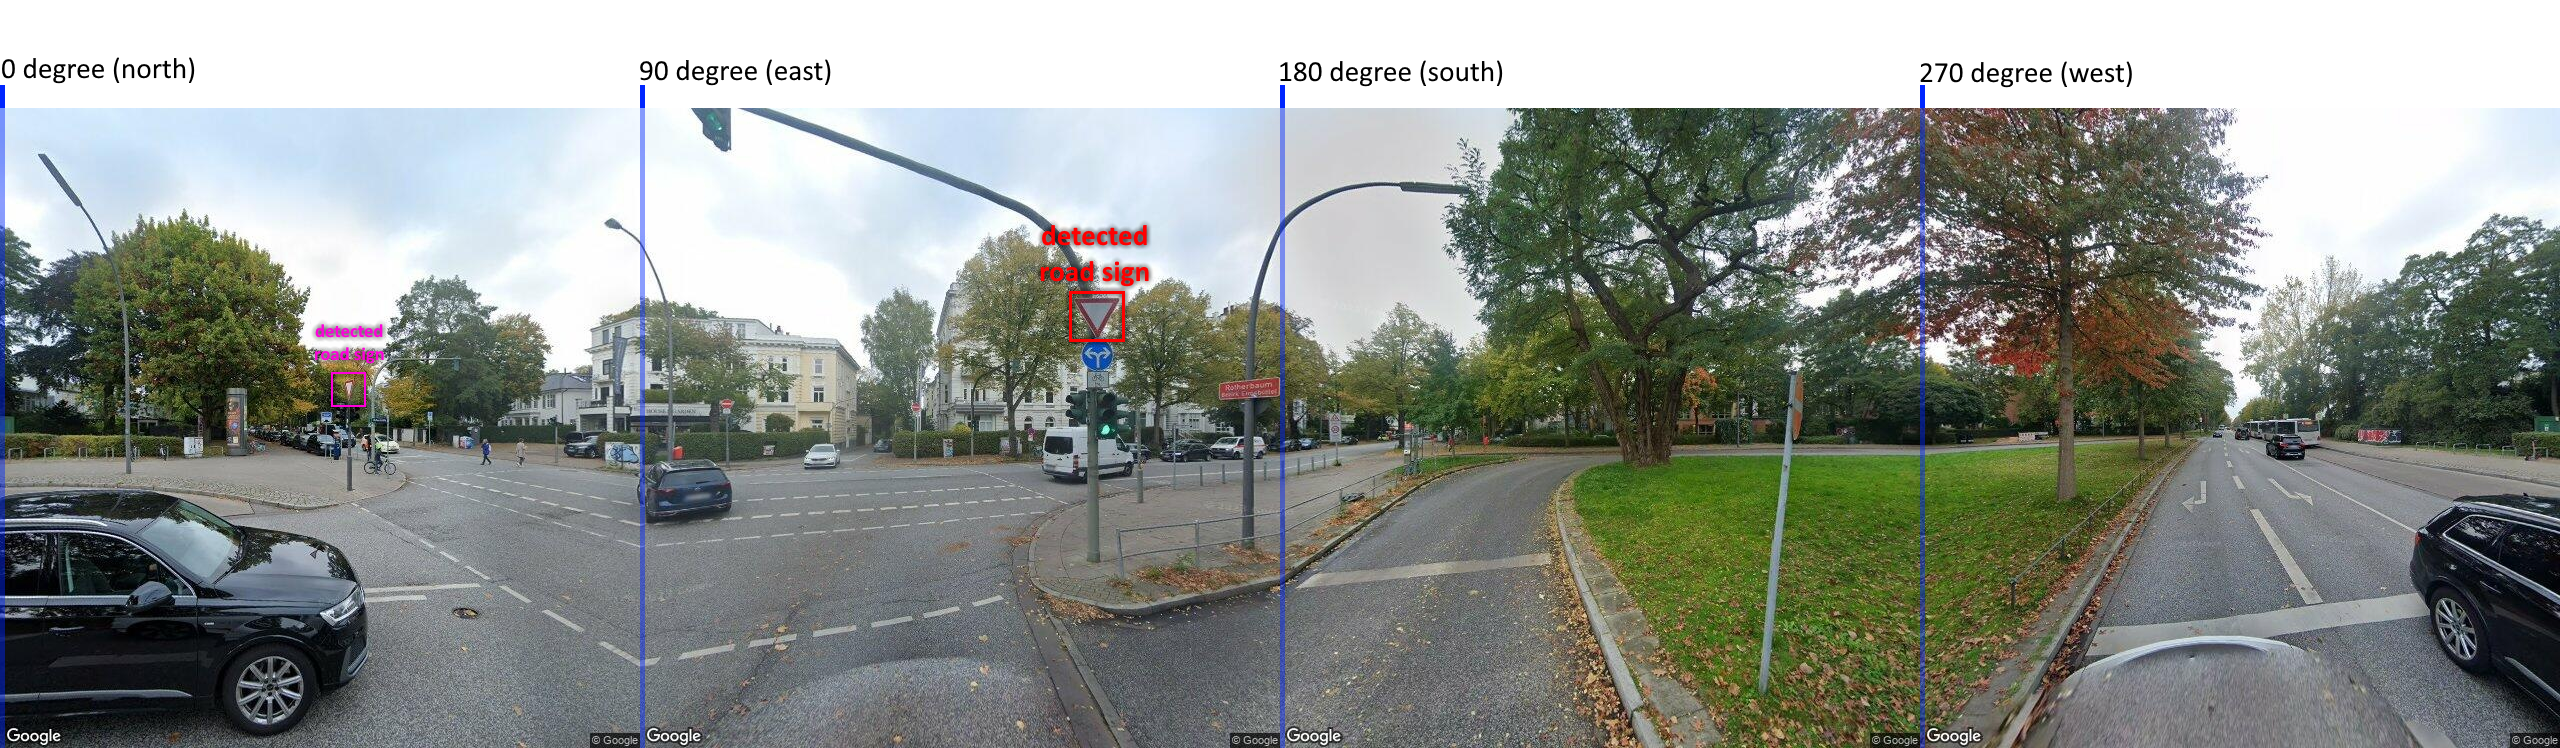
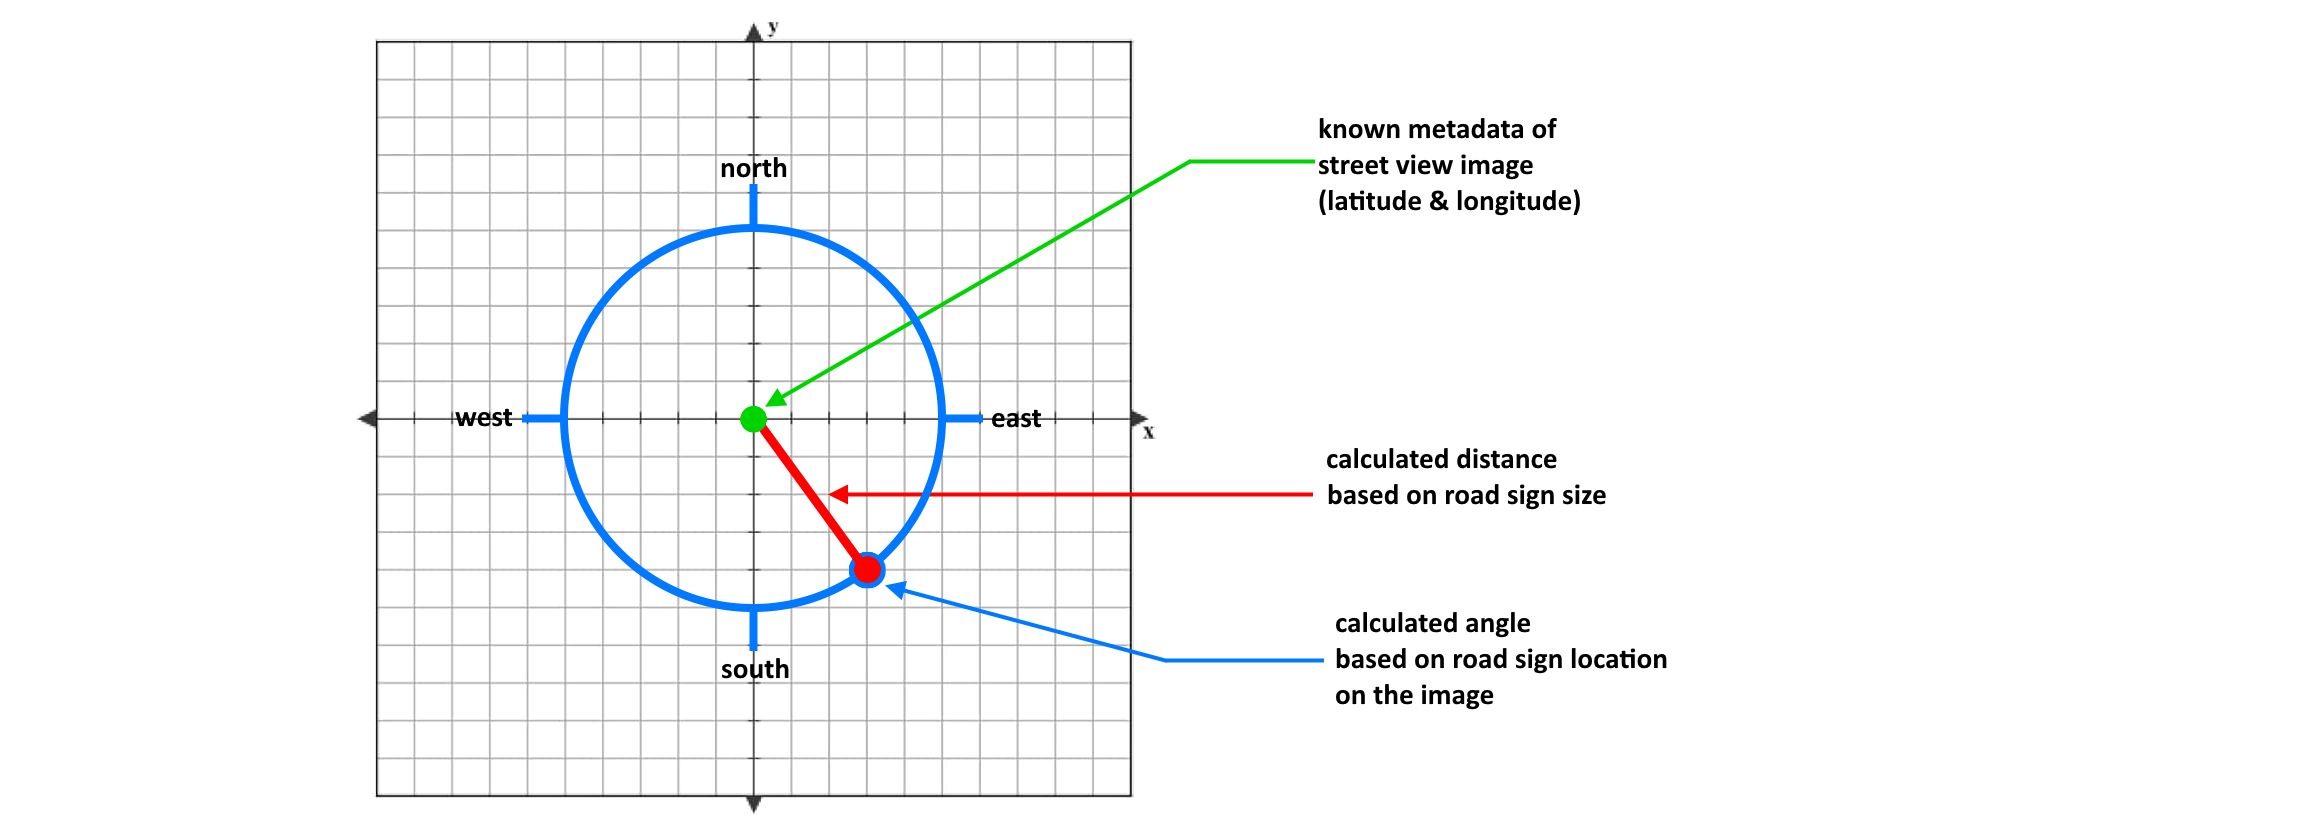
  2. Calculate angle and distance based on the image. As we have 360 degree panorama pictures, and the left most side is always directly facing north. With this we can
  3. Triangulate the position of the road sign based of at least 3 images of the same sign

Triangulation

Triangulation works by knowing the distance of an object X relative to three seperate other objects, and with this position of X can be determined by the overlap of each circle.

image

Solution

The first approach however would not work for two symbolically equal road signs next to each other, or where a road sign is seen from two different streets as seen in this example:

image

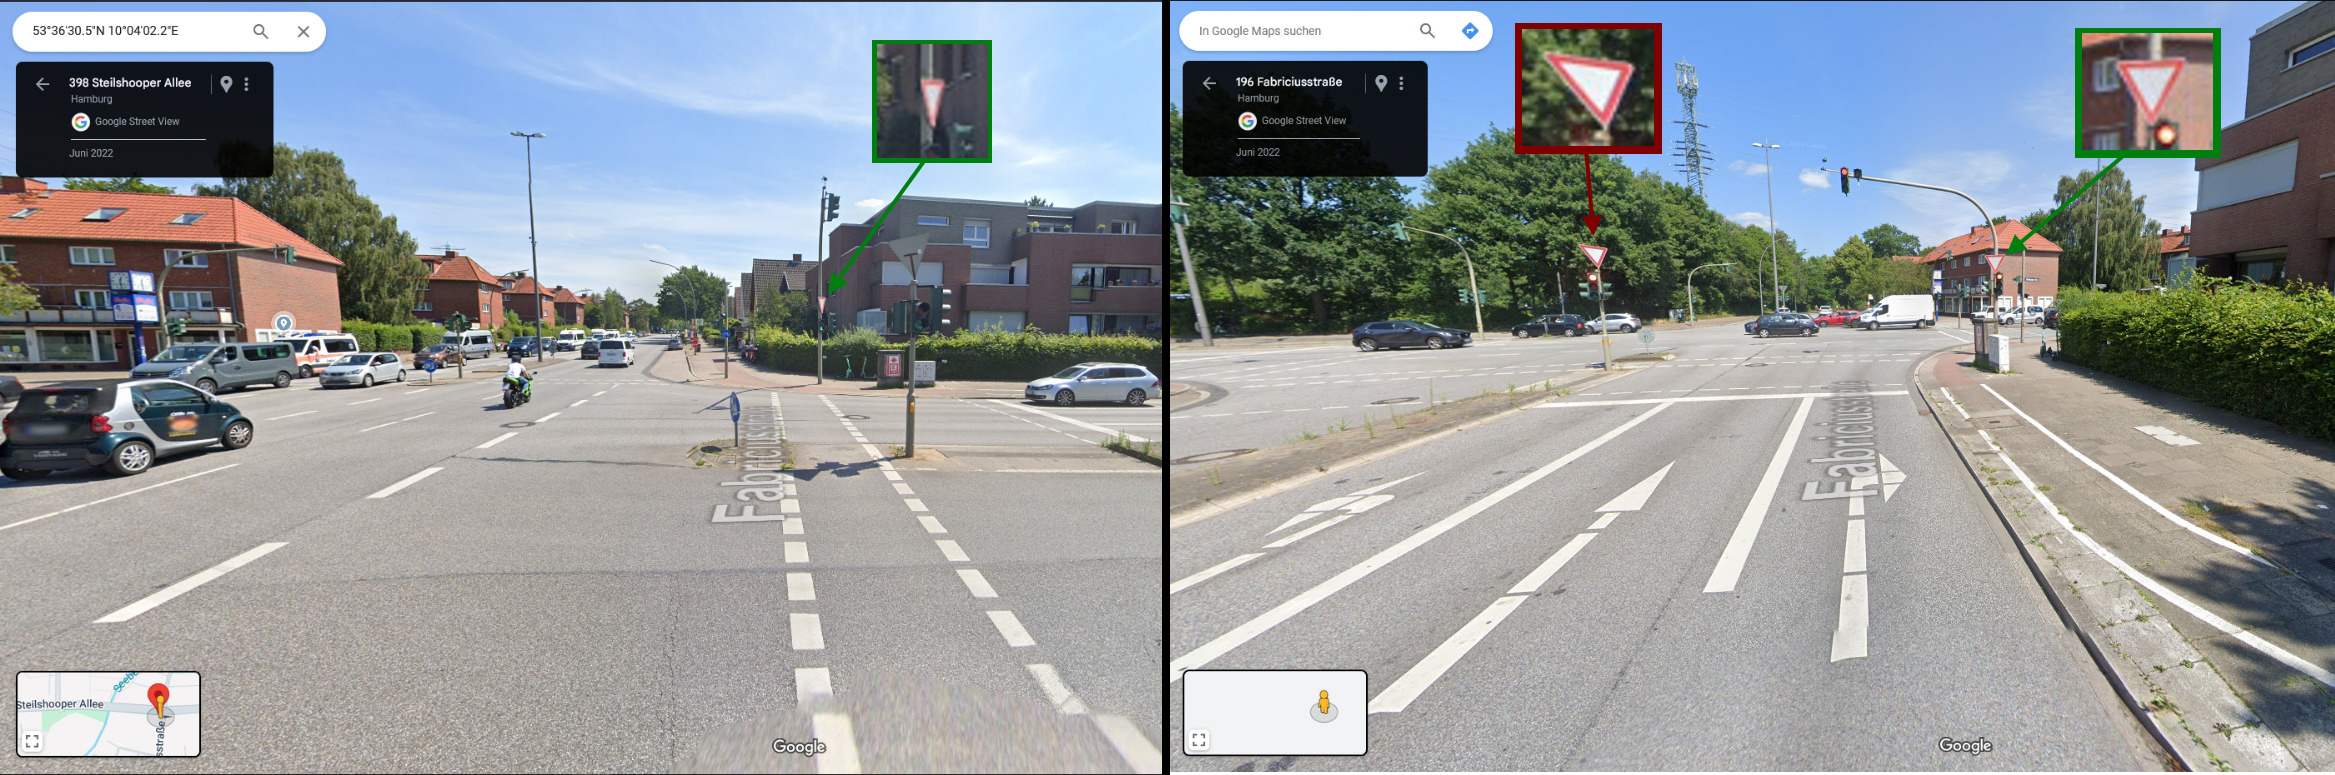
The green road sign is the exact same, however the two images are from different angles and completely different streets (street name + number in top left of each picture). This makes this approach not feasible.

Also differentiating between the red-outlined and green-outlined road signs would be difficult when crunching the data like described previously.

Using the second approach we can calculate each individual road sign for each picture and we get pretty accurate results for the location of the road sign. It is also not a problem that we count a single sign multiple times from different images, as we can group road signs that are very close to each other within a small threshold (~0.5 meter for example) and average the latitude and longitude and count the result as a unique road sign.

image

image

Approach 2 has been chosen to be used in this project, approach 3 could theoretically result in more precise data, however it would be way more difficult to implement and more computationally intensive for only very little upside, as approach two comes close to triangulating by averaging out the results of multiple images.

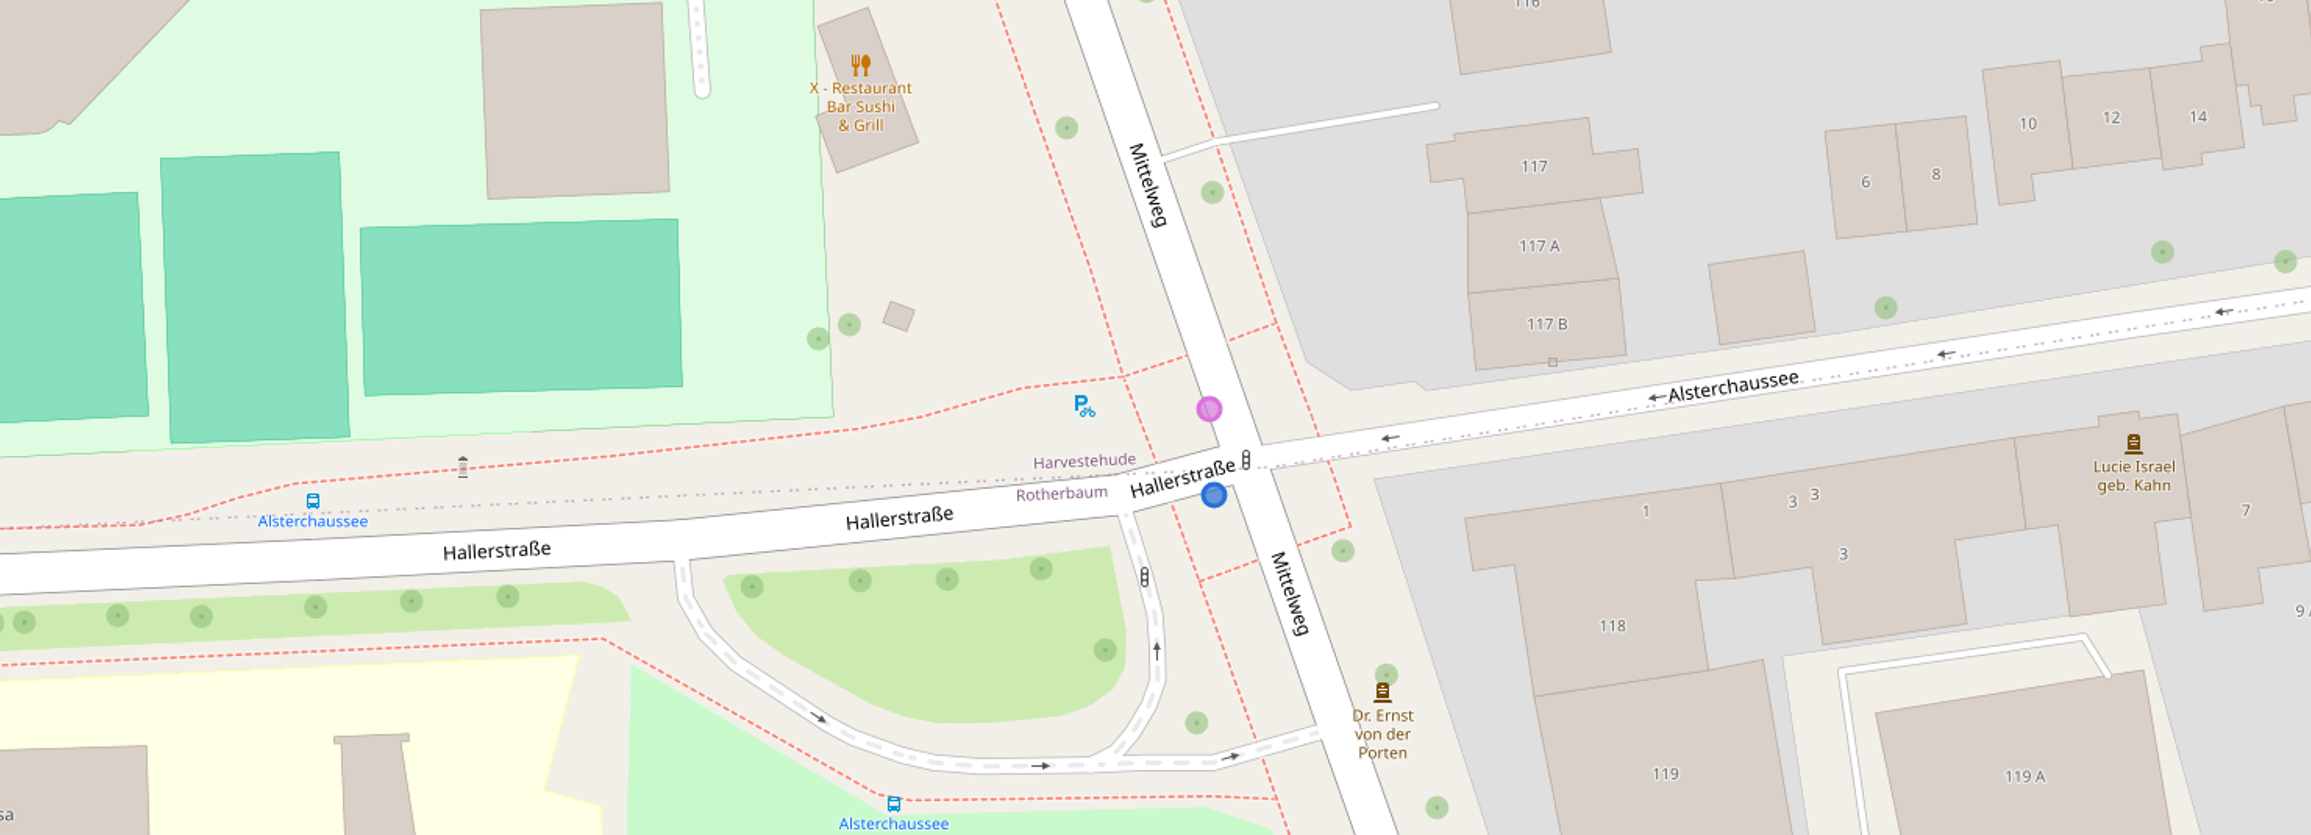
Step 5: Data Visualization

The python package folium can be used to generate a html file of a map with a visualization of all road signs from the result of the previus step

Journey

2024-10-06

This is one of the first results I obtained for a known location for which I generated the panorama 360-degree picture from Google Street View. As of this writing, I have not implemented an AI yet; I just took the picture myself, determined the coordinates using image editing software (paint.net), and used the results.

image

A problem I found is that the coordinates from Google Maps are slightly off compared to other maps (like the map I generated in Python using folium), making it challenging to establish a standardized solution.

Example Image Metadata

    {
        "id": "e5ea53ba-079e-42fe-a7ce-a128b4e75894",
        "latitude": 53.57279702543914,
        "longitude": 9.993901152892901,
        "city": "Hamburg",
        "country": "Germany",
        "postal_code": "20",
        "street_number": "117",
        "street_name": "Hallerstraße",
        "signs": [
            {
                "sign-type": "de-205",
                "x-start": 1073,
                "y-start": 190,
                "x-end": 1120,
                "y-end": 228
            },
            {
                "sign-type": "de-205",
                "x-start": 343,
                "y-start": 272,
                "x-end": 354,
                "y-end": 290
            }
        ],
        "img-width": 2560,
        "img-height": 640
    }

Example result for sign location

The values for source_angle and source_distance are not necessary to include in the final result data, and are included just completeness of this step.

[
    {
        "source": "e5ea53ba-079e-42fe-a7ce-a128b4e75894",
        "source_angle": 114.1953125,
        "source_distance": 1.2483377659574466,
        "latitude": 53.572792429416424,
        "longitude": 9.99391837895508,
        "sign_type": "de-205"
    },
    {
        "source": "e5ea53ba-079e-42fe-a7ce-a128b4e75894",
        "source_angle": 9.0078125,
        "source_distance": 4.8224431818181825,
        "latitude": 53.572839811712896,
        "longitude": 9.99391257534072,
        "sign_type": "de-205"
    }
]

2024-10-11

This project will be set on ice as I encountered difficulties in correctly calculating the angle of the signs based on the pictures. It doesn't simply work like I expected, because the picture is not a real 360° panorama picture, but stitched together from 4 individual pictures, resulting in a distortion when calculating the angles, which results in angles which dont represent the real situation.

image

2024-10-12

I didn't want to give up so I tried changing the algorithm calculating the angles, but couldn't get anything to work. So instead I researched and found that there is a python package streetview which can get me 360° panorama pictures.

Before: (4 individual pictures stitched together)

image

After: (360° panorama streetview)

image

With this I can more accurately determine the angle, as the angles are not distorted. However, I just can't figure out the right algorithm to calculate where the signs are, for a single picture like in the first journal entry I played around and "forced" the numbers to fit where I needed them, however with two pictures which have the same signs I can't line them up properly.

image

The green dots are the original image locations, and to them there are each two colored circles connected, which represent a specific road sign. Both pink circles are in reality the same road sign, same for the blue ones. They are off by a few meters from where they should be (the sad red smiley faces).

This is the image data I was working with

[
    {
        "id": "a6bab695-5d89-4f65-81dd-bf5c5b8aa2b3",
        "latitude": 53.572776060309174,
        "longitude": 9.993771512091937,
        "signs": [
            {
                "sign-type": "left",
                "x-start": 754,
                "y-start": 478,
                "x-end": 768,
                "y-end": 491
            },
            {
                "sign-type": "right",
                "x-start": 1108,
                "y-start": 457,
                "x-end": 1123,
                "y-end": 469
            }
        ],
        "img-heading": 81.94623565673828,
        "img-width": 2048,
        "img-height": 1024
    },
    {
        "id": "05206bbf-3adc-4fd4-84cc-5616b71c699d",
        "latitude": 53.57280585790424,
        "longitude": 9.993906523161941,
        "signs": [
            {
                "sign-type": "left",
                "x-start": 495,
                "y-start": 464,
                "x-end": 502,
                "y-end": 475
            },
            {
                "sign-type": "right",
                "x-start": 1352,
                "y-start": 336,
                "x-end": 1391,
                "y-end": 387
            }
        ],
        "img-width": 2048,
        "img-height": 1024
        "img-heading": 81.22557830810547,
    }
]

I'm still fully convinced that in theory it should be possible based on this to figure out where the road signs are, but I can't get it to work as of now.

If anybody wants to try their own luck, the sign-types describe which one of the road signs they are pointing at.


Written: 2024-10-06 (not considering journey entries)