BESD (Bats' Epic Server Dashboard)
This is a place to document my journey in building BESD, a self-made dashboard to monitor various system metrics. The primary goal was to get hands-on experience with Docker and Docker Compose, understanding how multiple containers can communicate in a shared Docker network.
Intention
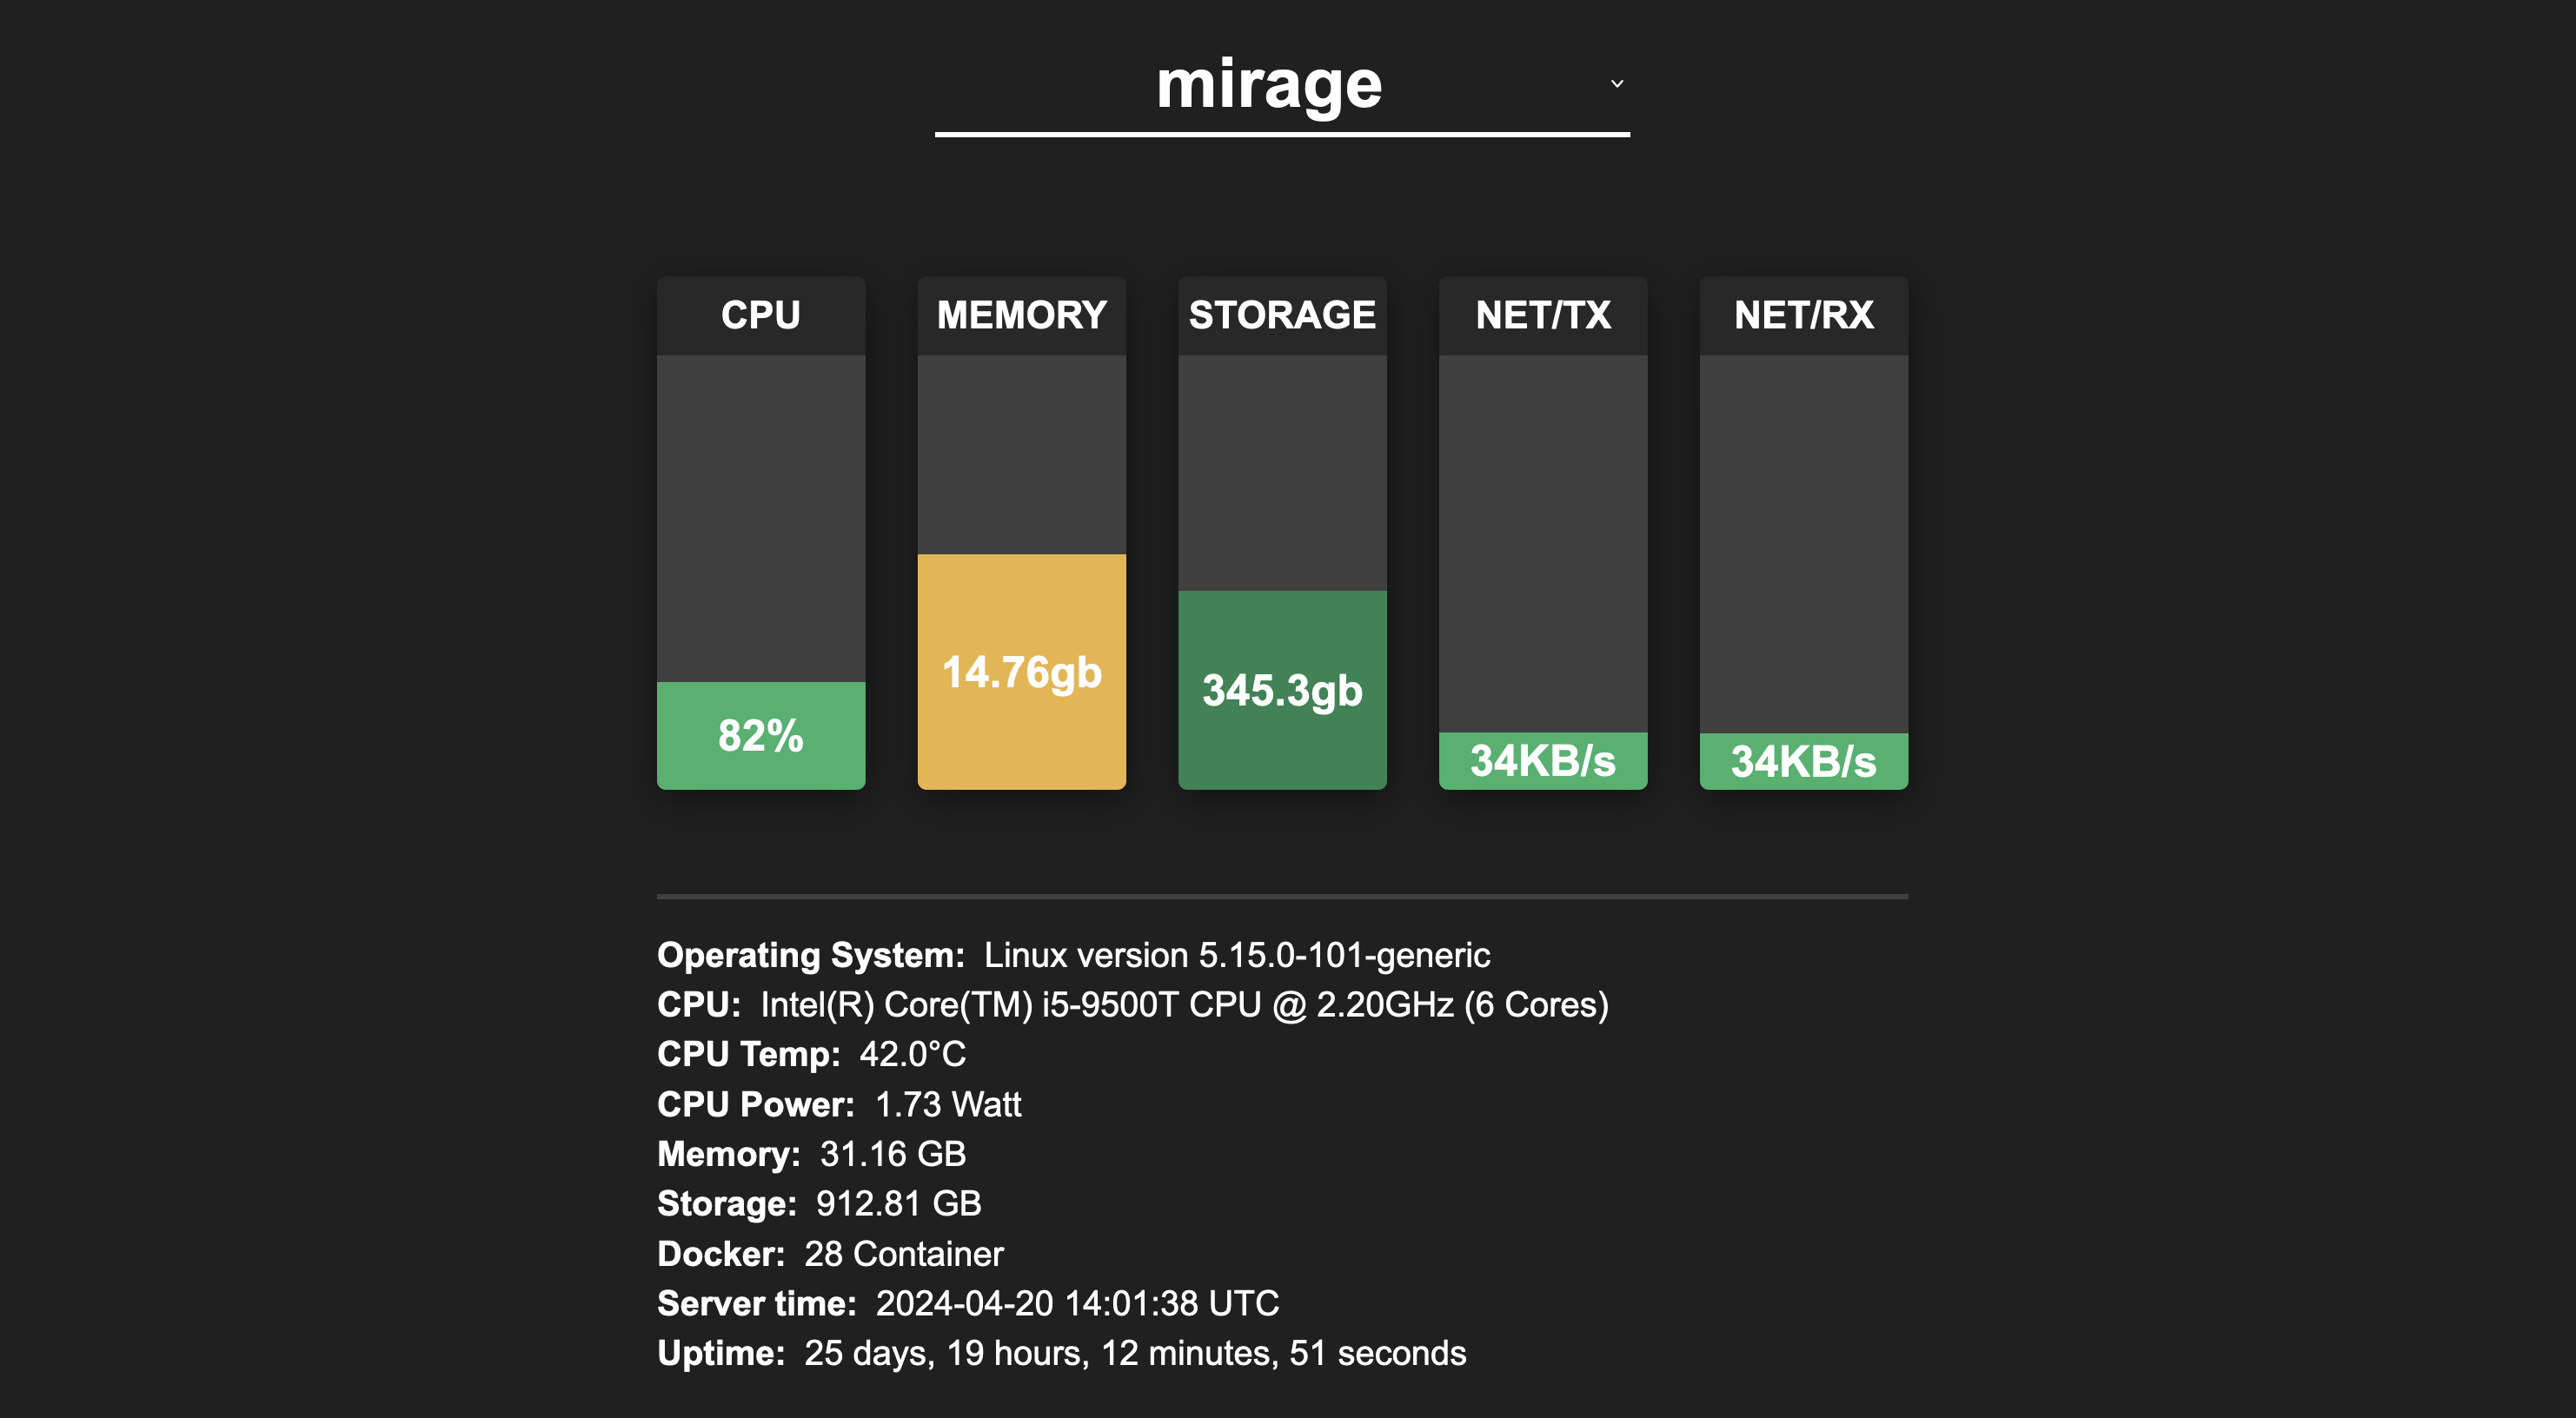
BESD is designed to monitor my home server's performance metrics and make them available through a simple web interface. The main focus was learning Docker, so the frontend is quite basic, but it gets the job done.
For my home server project, I wanted a custom solution that tracks important metrics like:
- Docker container stats
- Memory usage
- Storage usage
- Network activity (tx and rx)
- System information (OS, CPU name, CPU temperature, CPU power)
- Server time and uptime
- Number of running containers
All this data is collected and stored in a MySQL Docker container.
Implementation Details
I used three main Docker containers to accomplish this:
Python Metrics Collector
A Python script running in a Docker container continuously gathers stats and metrics from the server. It collects data on the previously mentioned statistics. This data is then stored in a MySQL database.
MySQL Database
The collected metrics are stored in a MySQL database, also running in its own Docker container. Nodes (python containers) can connect to this MySQL Database, to be scalable for future usage.
Apache Web Server
The frontend is served using an Apache web server. PHP is used to query the MySQL database and provide an API. JavaScript handles asynchronous calls to display the data. The UI is basic, with simple HTML and CSS, allowing users to see current metrics for any selected host. A dropdown at the top of the page lets users switch between hosts.
Discarded Ideas
Time Diagram
One of the ideas was to include charts showing historical data, but I decided not to pursue this since the main goal was learning Docker and Docker Compose. I would have needed to learn a charting library or framework for the frontend, and that wasn't my priority at this stage.
The frontend can support multiple hosts, which can be selected from the dropdown. However, all hosts must connect to the same MySQL server/container, as specified in the .env file.
What I learned from this
With this project I learned how to make my own docker images and run them.
Written: 2024-09-15